Quick Answer: What Are Candlestick Reversal Patterns?
- Candlestick reversal patterns are combinations of one to three candles that suggest a trend may be about to change direction.
- Bullish patterns, such as the morning star and three white soldiers, form after a decline and hint at a possible rise.
- Bearish patterns, such as the evening star and three black crows, form after an advance and hint at a possible fall.
- Most patterns need confirmation within one to three days, such as a strong follow-through candle or higher volume.
- Candlestick patterns are short-term signals that can fail, so they work best with support and resistance, trend and a clear exit plan.
What You Will Learn
- How to read the candles in a pattern
- Five bullish reversal patterns and how they form
- Five bearish reversal patterns and how they form
- How traders confirm candlestick signals
- The limits of candlestick patterns and common mistakes
Before You Start: How to Read the Candles
Each candle shows a period's open, high, low and close. A white (often green) candle closes above its open; a black (often red) candle closes below its open. The thin lines above and below the body are called shadows or wicks.
This cheat sheet builds on our guide to how to read a candlestick chart, which covers the doji, hammer, shooting star and engulfing patterns. Here we focus on ten other widely followed reversal patterns.
Five Bullish Reversal Patterns
These patterns should appear after a decline. Without a prior downtrend, there is nothing to reverse.
1. Inverted hammer (1 candle). The price opens, trades well higher during the session, then falls back to close near the open. The result is a small body with a long upper shadow. It hints that buyers are starting to test higher prices.
2. Piercing line (2 candles). A long black candle is followed by a white candle that opens below the previous close and then closes above the midpoint of the black candle's body. A close below the midpoint is not considered a bullish piercing line.
3. Bullish harami (2 candles). A large candle, usually black, is followed by a small candle whose body sits entirely inside the previous body. The small body shows selling pressure is easing. If the second candle is a doji, the chance of a reversal is considered higher.
4. Morning star (3 candles). A long black candle, then a small candle that gaps lower, then a long white candle that closes above the midpoint of the first candle's body. The third candle acts as the confirmation.
5. Three white soldiers (3 candles). Three long white candles in a row. Each opens within the previous candle's body and closes near its high, showing steady buying pressure.
Five Bearish Reversal Patterns
These patterns should appear after an advance. Without a prior uptrend, there is nothing to reverse.
1. Hanging man (1 candle). During an uptrend, the price drops sharply after the open, then recovers to close well above the low. The result is a small body with a long lower shadow. It shows sellers were active during the session, even though buyers pushed the price back up.
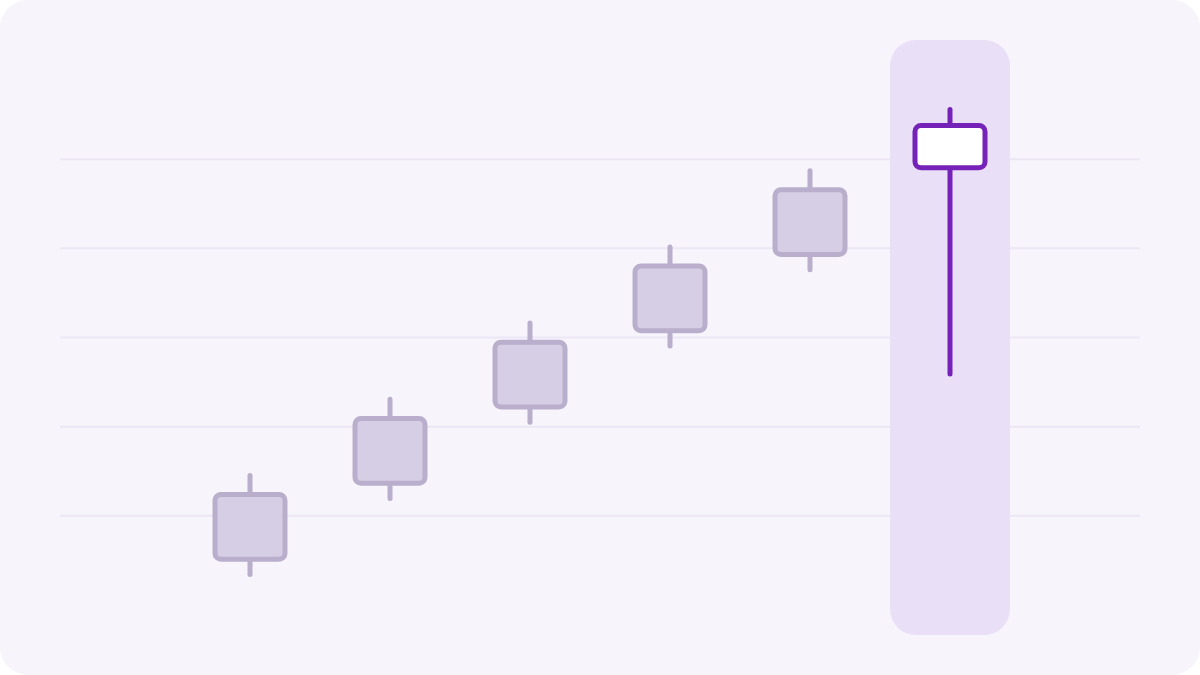
Hanging man: a small body with a long lower shadow after an advance
2. Dark cloud cover (2 candles). A long white candle is followed by a black candle that opens above the previous close and then closes below the midpoint of the white candle's body. A close above the midpoint is not considered bearish.
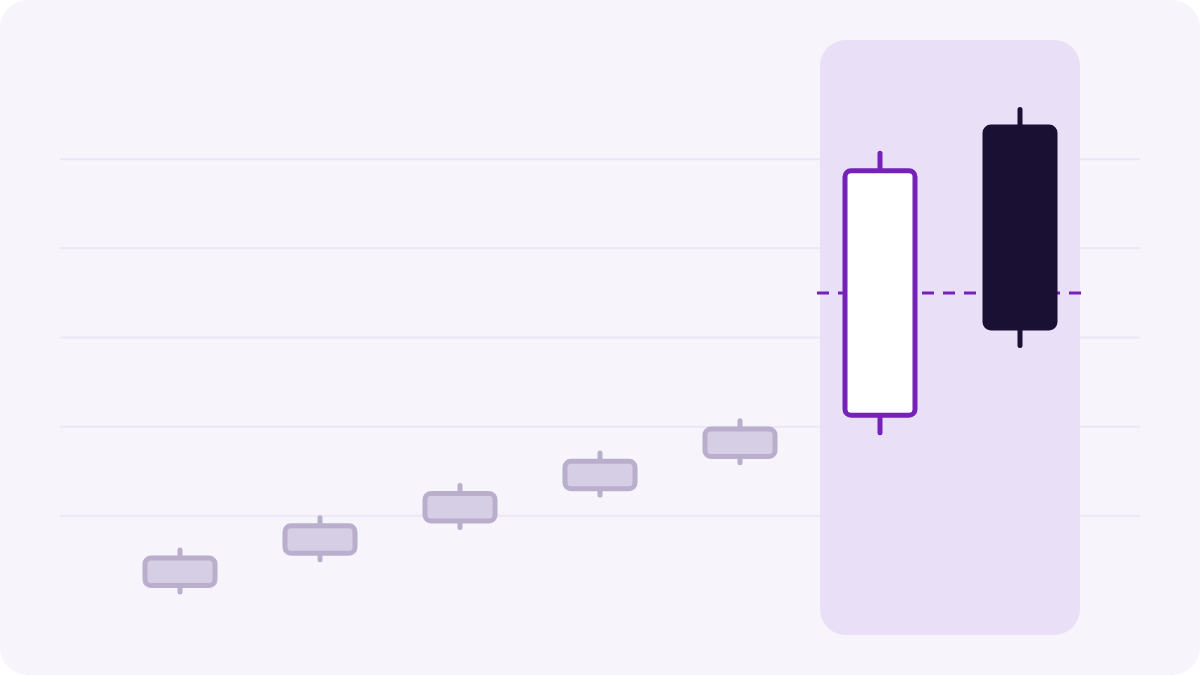
Dark cloud cover: the black candle closes below the midpoint (dashed line) of the white candle
3. Bearish harami (2 candles). A large candle, usually white, is followed by a small candle whose body sits entirely inside the previous body. It suggests buying momentum is fading. A doji as the second candle is considered a stronger warning.
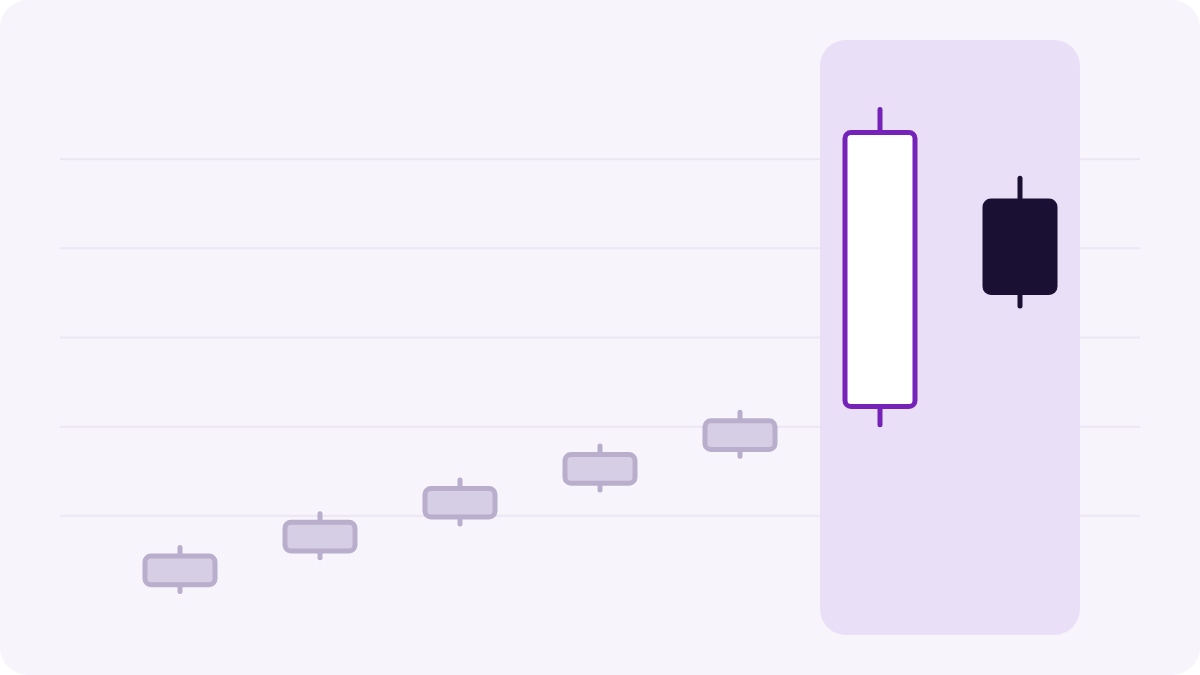
Bearish harami: a small body inside the previous large body
4. Evening star (3 candles). A long white candle, then a small candle that gaps higher, then a long black candle that closes below the midpoint of the first candle's body. The third candle acts as the confirmation.
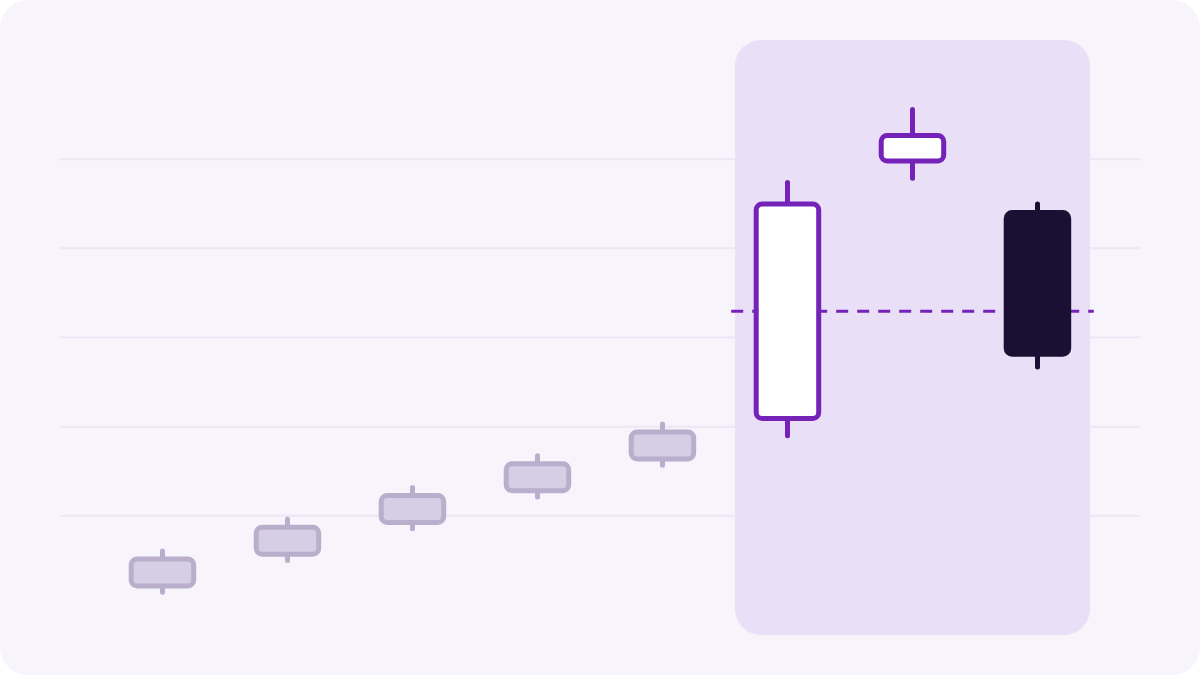
Evening star: the third candle closes below the midpoint (dashed line) of the first
5. Three black crows (3 candles). Three long black candles in a row. Each opens within the previous candle's body and closes at or near its low, showing steady selling pressure.
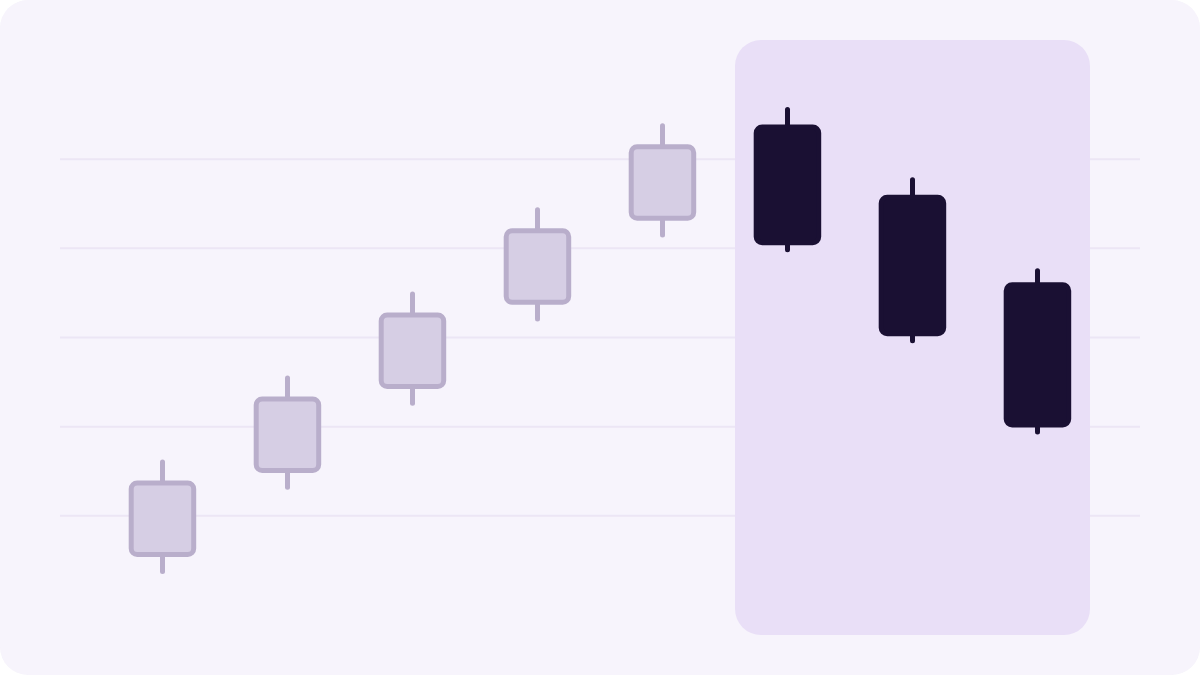
Three black crows: three long black candles, each opening within the previous body
Candlestick Patterns at a Glance
| Pattern | Candles | Signal | Forms After |
|---|---|---|---|
| Inverted hammer | 1 | Bullish | A decline |
| Piercing line | 2 | Bullish | A decline |
| Bullish harami | 2 | Bullish | A decline |
| Morning star | 3 | Bullish | A decline |
| Three white soldiers | 3 | Bullish | A decline |
| Hanging man | 1 | Bearish | An advance |
| Dark cloud cover | 2 | Bearish | An advance |
| Bearish harami | 2 | Bearish | An advance |
| Evening star | 3 | Bearish | An advance |
| Three black crows | 3 | Bearish | An advance |
Source: StockCharts ChartSchool, "Candlestick Pattern Dictionary", "Candlestick Bullish Reversal Patterns" and "Candlestick Bearish Reversal Patterns".
How Traders Confirm Candlestick Patterns
According to StockCharts, most candlestick reversal patterns need confirmation within one to three days, and their effect is often short-term, lasting around one to two weeks. Common checks include:
- Follow-through: a gap or a long candle in the new direction, or a move on higher volume. Learn why volume matters in why volume matters in short-term trading.
- Location: patterns near clear support and resistance levels carry more weight.
- Trend context: traders often check the trend with a short-term moving average, such as the 20-day EMA. See moving averages explained.
- Momentum: divergence on indicators such as the RSI or MACD can support a reversal signal.
Without confirmation, a bullish pattern is at best a possible support area, and a bearish pattern at best a possible resistance area.
Limits of Candlestick Patterns and Mistakes to Avoid
- Ignoring the prior trend. A bullish pattern in the middle of an uptrend, or a bearish one in a downtrend, is not a reversal signal.
- Acting without confirmation. Many patterns fail if the next candles do not follow through.
- Expecting long-term predictions. Candlestick signals are short-term and usually matter for days to a few weeks.
- Using patterns alone. Combine them with trend, volume, support and resistance, and indicators.
- Trading without an exit plan. Decide where you would exit if the signal fails. See our stop-loss and take-profit guide.
Candlesticks show short-term price behaviour, not company value. For that, use our fundamental analysis guide.
Related Articles on Raseed Learn
What Is a Candlestick Chart? · Support and Resistance Levels Explained · What Is Technical Analysis
Read the candles, then make your move
Invest in US stocks from $1 with fractional shares. US stock trading fees are 0.5% per trade, with a $0.50 minimum and a $3 maximum.
Explore US Stocks on Raseed →Frequently Asked Questions
Disclaimer
This article is for educational and informational purposes only. It is not investment advice, nor a recommendation, offer or solicitation to buy or sell any security or digital asset. Investing involves risk, including possible loss of principal. Past performance does not guarantee future results.
Securities brokerage services are provided by Fullerverse (SC) Limited, a securities broker-dealer licensed and regulated by the Financial Services Authority of Seychelles (Licence No. SD152). Fullerverse (SC) Limited is a wholly-owned subsidiary of Raseed Invest Inc. Registered address: House of Francis, Room 302, Ile Du Port, Mahe, Seychelles.
Cryptocurrency services are made available by Raseed Crypto LLC ("Raseed Crypto"), a FinCEN-registered money services business (MSB Registration No. 31000316890439) and a wholly-owned subsidiary of Raseed Invest Inc. Cryptocurrencies are not stocks and your cryptocurrency investments are not protected by either FDIC or SIPC. Cryptocurrency is highly speculative in nature and involves a high degree of risk, including volatile market price swings, market manipulation, flash crashes and cybersecurity risks. Cryptocurrency regulations are continuously evolving, and it is your responsibility to understand and abide by them. Cryptocurrency trading can lead to large, immediate and permanent loss of financial value. You should have appropriate knowledge and experience before engaging in cryptocurrency trading. For additional information, please see our Crypto Risk Disclosures (https://files.raseedcapital.com/disclosures/library/CryptoRiskDisclosures.pdf).
Cryptocurrency services are not offered by, and are not available through, Raseed Invest Limited, which is regulated by the Dubai Financial Services Authority. Products and services referenced in this article are not available in all jurisdictions and are not directed at any person in a jurisdiction where their offer or availability would be contrary to local law or regulation.