Quick Answer
- Technical analysis is a way of studying a stock's past price and trading volume to judge where its price may move next.
- It uses charts, trends, support and resistance levels, and indicators such as moving averages, RSI and MACD.
- It focuses on *when* to buy or sell, while fundamental analysis focuses on *what* a company is worth.
- It is most popular with short-term traders, but long-term investors also use it to plan entry and exit points.
- Technical analysis deals in probabilities, not certainties. Signals can fail, so it works best with clear risk management.
What You Will Learn
- What technical analysis is and where it came from
- The three core ideas behind it
- The main tools: charts, trends, support and resistance, volume and indicators
- How it compares with fundamental analysis
- Its limits, and how beginners can start using it safely
What Is Technical Analysis?
Technical analysis is the study of market data, mainly price and volume, to identify trends and possible turning points in a stock's price. Instead of reading a company's financial statements, a technical analyst reads its chart. The aim is to find patterns in how buyers and sellers have behaved, and to use those patterns to make better-timed decisions.
The approach traces back to Charles Dow, co-founder of Dow Jones & Company and the first editor of *The Wall Street Journal*. His editorials around 1900 became known as Dow Theory, which argued that markets move in trends. Japanese rice traders developed candlestick charts even earlier, in the 18th century, and these were later popularised in the West by Steve Nison in the early 1990s.
The Three Core Ideas Behind Technical Analysis
- Price reflects available information. News, earnings and investor sentiment are assumed to show up in the share price, so the chart is the main thing to study.
- Prices tend to move in trends. A stock that is rising is more likely to keep rising than to reverse suddenly, until there is evidence the trend has changed.
- History tends to repeat. Human emotions such as fear and greed create similar chart patterns over time.
The Main Tools of Technical Analysis
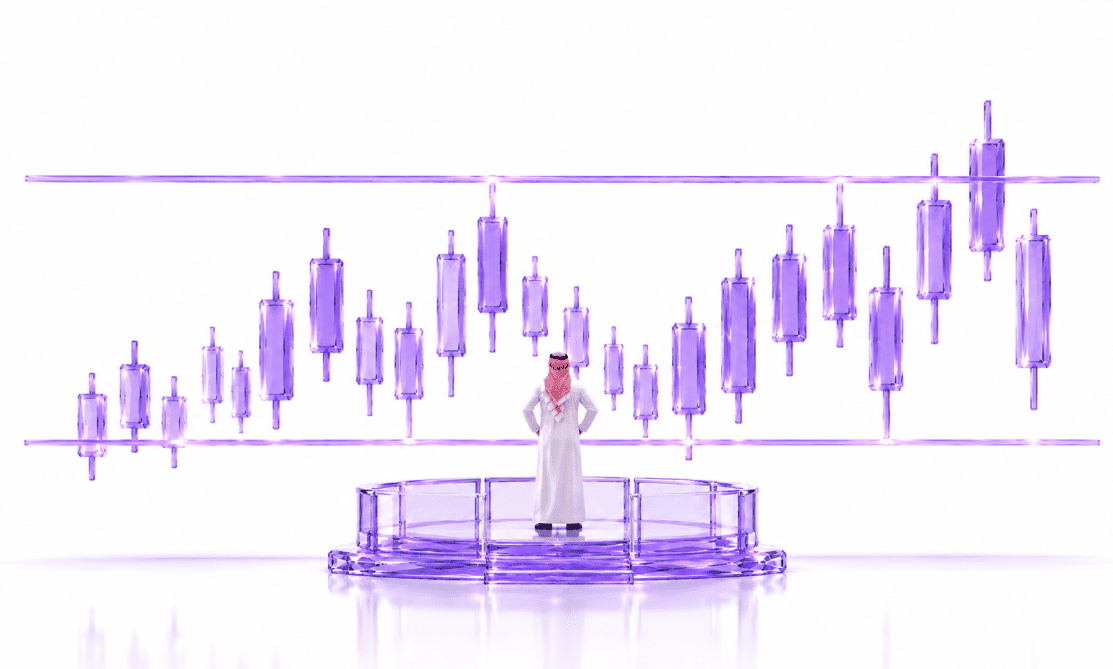
1. Price charts. The most common types are line charts, bar charts and candlestick charts. Each candle shows a period's open, high, low and close. If you are new to them, start with our guide on how to read a candlestick chart.
2. Trends. An uptrend shows higher highs and higher lows; a downtrend shows lower highs and lower lows. Many traders follow a simple rule: trade in the direction of the trend.
3. Support and resistance. Support is a price level where buying has tended to stop a fall. Resistance is a level where selling has tended to stop a rise. When a price breaks through one of these levels, traders treat it as a possible signal.
4. Volume. Volume shows how many shares changed hands. A price move on high volume is usually seen as stronger than one on low volume. Our guide on why volume matters in short-term trading explains this in detail.
5. Technical indicators. These are calculations based on price or volume, shown on or below the chart.
| Indicator | Type | What it shows | Common use |
|---|---|---|---|
| Moving average (SMA / EMA) | Trend | The average price over a set period, such as 50 or 200 days | Spotting the trend direction and possible support |
| Relative Strength Index (RSI) | Momentum | Speed of price changes on a 0 to 100 scale | Readings above 70 are often called overbought; below 30, oversold |
| MACD | Trend and momentum | The gap between two moving averages | Crossovers can signal a change in momentum |
| Bollinger Bands | Volatility | A band around a moving average that widens and narrows | Showing when prices are unusually high, low or volatile |
| Volume | Participation | Number of shares traded | Confirming whether a move has strong backing |
Technical Analysis vs Fundamental Analysis
| Factor | Technical Analysis | Fundamental Analysis |
|---|---|---|
| Main question | When should I buy or sell? | What is this company worth? |
| Data used | Price, volume and charts | Revenue, earnings, cash flow and valuation ratios |
| Typical time frame | Days to months | Months to years |
| Common users | Traders and short-term investors | Long-term investors |
Many investors combine the two: they use fundamentals to choose *which* stocks to own and technical analysis to decide *when* to act. Learn the other side in our fundamental analysis guide for GCC investors.
Does Technical Analysis Work?
Opinions are divided. Supporters argue that trends and crowd behaviour create repeatable patterns. Critics point to the efficient market hypothesis, associated with economist Eugene Fama, which holds that past prices cannot reliably predict future prices.
What most experienced traders agree on is this: no pattern or indicator is right every time. Signals can be false, especially in quiet or very volatile markets, and the same chart can be read in different ways. Technical analysis is a tool for managing probabilities and risk, not a way to predict the future.
Common Mistakes Beginners Make
- Using too many indicators at once, which often leads to conflicting signals.
- Ignoring the bigger trend and trading against it.
- Trading without a stop-loss. Set your exit before you enter. See our stop-loss and take-profit guide.
- Forgetting the news. Earnings reports and economic data can override any chart pattern.
- Overtrading. More trades mean more fees and more chances to make emotional decisions. Our article on common day trading mistakes covers this.
How to Start Using Technical Analysis
- Learn to read candlestick charts and identify the trend.
- Mark clear support and resistance levels on a few well-known US stocks.
- Add one or two indicators, such as a 50-day moving average and RSI.
- Practise by watching how signals play out before committing money.
- Always decide your position size and exit point in advance. Our guide to understanding risk in stock trading can help.
Put your chart skills into practice. With Raseed Invest, you can follow live price charts on US stocks and ETFs and invest from $1 with fractional shares, with fees of 0.5% per trade, capped at $3. → Explore US stocks on Raseed Invest
Frequently Asked Questions
Ready to start reading the market? → Open your Raseed Invest account
Related Articles
- What Is a Candlestick Chart?
- Liquidity, Volume and Volatility: What Day Traders Watch First
- Bull vs Bear Market Explained
Disclaimer
This article is for educational and informational purposes only. It is not investment advice, nor a recommendation, offer or solicitation to buy or sell any security or digital asset. Investing involves risk, including possible loss of principal. Past performance does not guarantee future results.
Securities brokerage services are provided by Fullerverse (SC) Limited, a securities broker-dealer licensed and regulated by the Financial Services Authority of Seychelles (Licence No. SD152). Fullerverse (SC) Limited is a wholly-owned subsidiary of Raseed Invest Inc. Registered address: House of Francis, Room 302, Ile Du Port, Mahe, Seychelles.
Cryptocurrency services are made available by Raseed Crypto LLC ("Raseed Crypto"), a FinCEN-registered money services business (MSB Registration No. 31000316890439) and a wholly-owned subsidiary of Raseed Invest Inc. Cryptocurrencies are not stocks and your cryptocurrency investments are not protected by either FDIC or SIPC. Cryptocurrency is highly speculative in nature and involves a high degree of risk, including volatile market price swings, market manipulation, flash crashes and cybersecurity risks. Cryptocurrency regulations are continuously evolving, and it is your responsibility to understand and abide by them. Cryptocurrency trading can lead to large, immediate and permanent loss of financial value. You should have appropriate knowledge and experience before engaging in cryptocurrency trading. For additional information, please see our Crypto Risk Disclosures (https://files.raseedcapital.com/disclosures/library/CryptoRiskDisclosures.pdf).
Cryptocurrency services are not offered by, and are not available through, Raseed Invest Limited, which is regulated by the Dubai Financial Services Authority. Products and services referenced in this article are not available in all jurisdictions and are not directed at any person in a jurisdiction where their offer or availability would be contrary to local law or regulation.