

A Plain-Language Technical Analysis Introduction for GCC Investors
Quick Answer: What Is a Candlestick Chart?
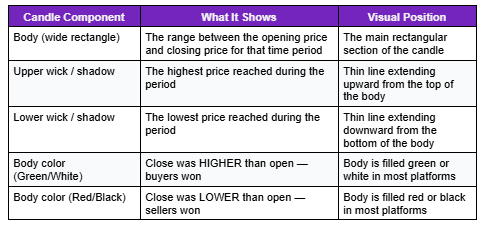
A candlestick chart displays four price points for any time period: the opening price, closing price, highest price, and lowest price, all within a single visual element called a "candle"
A green (or white) candle means the closing price was higher than the opening price, indicating that buyers dominated that period.
A red (or black) candle means the closing price was lower than the opening price, sellers dominated that period
The wide part of the candle (the "body") shows the open-to-close range; the thin lines above and below (the "wicks" or "shadows") show the high and low extremes
Candlestick patterns are signals about short-term supply and demand. They are most useful when combined with other analysis, not used in isolation.
A candlestick chart is the most widely used chart type in stock trading globally and understanding how to read one is the starting point for any technical analysis.
Candlestick charts were developed in Japan in the 18th century by rice traders, introduced to Western financial markets by Steve Nison in his 1991 book "Japanese Candlestick Charting Techniques." Today, every major trading platform Today, many major trading platforms use candlestick charts as a common way to display price movement. They are more information-dense than simple line charts because each candle shows four price points simultaneously, not just the closing price.
For Saudi and GCC investors who use platforms like Raseed to monitor their US stock and TASI positions, being able to read a candlestick chart is a basic literacy skill. It does not require becoming a technical analyst, it requires understanding what information each candle is communicating at a glance.
Anatomy of a Single Candlestick
Every single candle contains four pieces of information: open, close, high, and low.
View real-time candlestick charts for Saudi and US stocks on the Raseed app — from any GCC device. → Open your Raseed account and start analysing →
The Most Important Candlestick Patterns for GCC Investors
These five patterns appear frequently in technical analysis, but they should be treated as probabilistic signals rather than reliable predictions.
1. Doji
A Doji candle has a very small body — meaning the opening and closing prices are nearly identical. This signals indecision: buyers and sellers were equally matched for that period. A Doji after a sustained uptrend or downtrend suggests momentum may be exhausting. Context matters — a Doji in isolation has limited value; a Doji following a long run of directional candles is more significant.
2. Hammer (Bullish Reversal)
A hammer has a small body at the top of the candle with a long lower wick — at least twice the length of the body. It signals that sellers pushed prices significantly lower during the period, but buyers recovered almost all of those losses by the close. A hammer appearing after a downtrend is interpreted as a potential reversal signal — sellers tried to push lower but were overwhelmed by buyers.
3. Shooting Star (Bearish Reversal)
A shooting star is the inverse of a hammer: small body at the bottom, long upper wick. Buyers pushed prices significantly higher during the period, but sellers pushed them back down to near the opening price. A shooting star after an uptrend suggests buyers are losing control. This pattern is why Raseed investors who track TASI's daily charts sometimes see sharp intraday surges that close back near the open — a common shooting star pattern.
4. Bullish Engulfing
A bullish engulfing pattern consists of two candles: a small red candle followed by a larger green candle whose body completely "engulfs" the prior red candle. This pattern signals that buyers overwhelmed sellers so completely that they reversed the entire prior session's losses and added significantly more. In trending analysis, a bullish engulfing after a pullback in an uptrend often indicates the uptrend resuming.
5. Bearish Engulfing
The opposite of bullish engulfing: a small green candle followed by a larger red candle that engulfs the green body. Sellers overwhelmed buyers completely. This pattern after an uptrend is a warning that selling pressure has increased significantly.
Technical analysis using candlesticks works best when combined with fundamental research. Our fundamental analysis guide for GCC investors covers how to combine chart reading with balance sheet and earnings analysis for more robust investment decisions.
Key Limitations of Candlestick Analysis
Candlestick patterns are probabilities, not certainties — and they work less reliably on individual stocks than on indices.
Academic studies show mixed results, and the reliability of candlestick patterns can vary by market, timeframe, and testing method. They are generally more useful as risk-management context than as standalone entry signals. Candlesticks are better as risk management tools than as standalone entry signals.
Patterns on short timeframes (1-minute, 5-minute candles) have lower reliability than daily or weekly patterns. GCC investors who trade intraday based on short-term candles are engaging in high-risk speculation.
Saudi stocks on TASI have distinct price behaviour because of the dominance of retail investors and oil price correlation, patterns developed in Western equity markets may have different reliability characteristics on TASI.
Candlestick analysis is not a substitute for understanding the business. A technically perfect setup on a fundamentally broken company is still a high-risk trade.
Frequently Asked Questions
Q: Which timeframe should I use for candlestick charts as a Saudi investor?
For long-term investing decisions, use weekly or daily candles. For medium-term position management, daily candles. For short-term tactical trades, 1-hour or 4-hour candles. Avoid making investment decisions from 1-minute or 5-minute candles, the noise-to-signal ratio is extremely high.
Q: Can candlestick charts predict the next day's TASI opening?
No. Candlestick patterns provide probabilistic context about supply and demand at a specific point in time. They cannot reliably predict specific next-day prices. TASI is particularly challenging for technical prediction because it trades Sunday through Thursday and during different hours from US markets, meaning Saudi market-specific news can create gaps between the previous close and the next open.
Q: Are there specific candlestick patterns that work better on Saudi stocks?
No peer-reviewed research has specifically identified TASI-specific outperforming candlestick patterns versus global studies. General academic consensus is that simple patterns (doji, hammer, engulfing) have modest predictive value across liquid markets. The best GCC-specific adaptation is to use candlestick patterns alongside oil price movement context for energy-heavy TASI stocks.
Q: Do I need to understand candlestick charts to invest on Raseed?
No. Long-term, fundamental investors buy and hold quality companies without needing to read charts. Candlestick knowledge is more useful for investors who are actively monitoring entry and exit timing on positions they have already decided to hold based on fundamental analysis.
Related Articles on Raseed Learn
How to Read an Earnings Report · How to Research GCC Stocks: Fundamental Analysis
Understanding Risk in Stock Trading · Most Common Investing Mistakes GCC Beginners Make
This article is for educational and informational purposes only and does not constitute investment advice. All investing involves risk, including the potential loss of principal. Data sourced from publicly available primary sources as of June 2026. Past performance does not guarantee future results. Securities brokerage services are provided by Fullerverse (SC) Limited, licensed and regulated by the Financial Services Authority Seychelles (Licence No. SD152), a wholly-owned subsidiary of Raseed Invest Inc. Raseed Invest Limited is regulated by the DFSA. Capital is at risk.