

A Plain-Language Guide to Three Core Valuation Tools for GCC Investors
Quick Answer: What Are P/B Ratio, EPS, and ROE?
Price-to-Book (P/B) ratio compares a stock's market price to its accounting book value per share, a P/B below 1 means the market values the company below its net assets
Earnings per Share (EPS) divides a company's net profit by its total shares outstanding, the primary per-share profitability metric used in every valuation model
Return on Equity (ROE) measures how efficiently a company generates profit from shareholders' equity, Saudi banks with strong profitability, such as Al Rajhi Bank, can generate ROE around or above 20%; Al Rajhi reported ROE of about 21.1% in 2024.
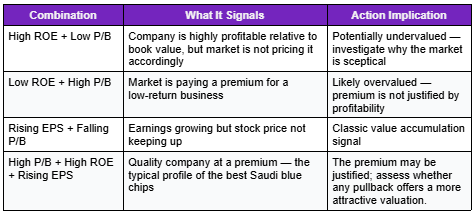
These three metrics work best together: a low P/B combined with high ROE and rising EPS signals a potentially undervalued quality company
TASI investors specifically should use P/B ratio when evaluating Saudi banks, since traditional P/E ratios can be less informative for Islamic banking business models
P/B ratio, EPS, and ROE are three valuation metrics that work as a set, each answering a different question about the relationship between a company's price, profitability, and efficiency.
Together with P/E ratio (price-to-earnings), these four metrics form the core toolkit of fundamental stock analysis. Understanding what each measures and how they interact, allows GCC investors to move beyond following tips and make informed decisions based on actual business data. This guide builds on our fundamental analysis article by covering three metrics with specific relevance to Saudi and GCC stock markets, particularly the banking sector.
Price-to-Book Ratio (P/B)
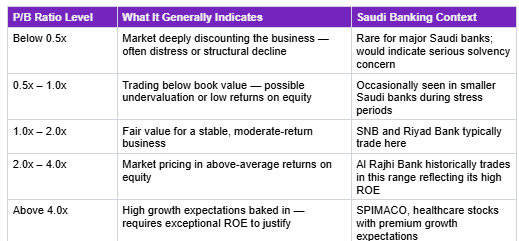
The P/B ratio tells you how much you are paying for each riyal of a company's net assets.
Book value is what remains after subtracting all liabilities from all assets on the balance sheet. Divide the current share price by book value per share and you get the P/B ratio. A P/B of 1.0 means the market is valuing the company exactly at its accounting net asset value. A P/B of 2.0 means the market is paying twice the book value, implying it expects the company to generate returns above the cost of capital. A P/B below 1.0 means the market is pricing the company below its net assets which can signal either deep undervaluation or serious business problems.
Earnings Per Share (EPS)
EPS is the most fundamental per-share profitability metric. It is what the P/E ratio is calculated from and one of the figures analysts project most carefully.
EPS is calculated by dividing a company's net profit by its weighted average number of shares outstanding. A company with SAR 1 billion in net profit and 500 million shares outstanding has an EPS of SAR 2. If the share price is SAR 40, the P/E ratio is 20x (price divided by EPS). EPS is also directly affected by share buybacks: when a company reduces its share count, EPS rises even if total profits are unchanged.
For GCC investors monitoring TASI quarterly results, Saudi companies report EPS in SAR in their interim financial statements. Watch for year-on-year EPS trends (is it growing or shrinking?), and for the relationship between revenue growth and EPS growth (is EPS growing faster or slower than revenue? Faster = improving margins; slower = deteriorating margins).
For a full guide on how earnings reports present EPS alongside other key metrics, see our how to read an earnings report guide, which covers the full earnings analysis process with real GCC examples.
Return on Equity (ROE)
ROE measures how many riyals of profit a company generates for every riyal of shareholders' equity, the most important profitability efficiency metric for Saudi bank investors.
ROE is calculated by dividing net income by average shareholders' equity, expressed as a percentage. A ROE of 20% means the company generates SAR 0.20 in profit for every SAR 1.00 of equity it holds. Saudi banking stocks are particularly relevant for ROE analysis because banks are capital-intensive businesses where the ability to generate returns on equity is a key competitive differentiator.
Al Rajhi Bank, Saudi Arabia’s largest Islamic bank, reported ROE of about 21.1% in 2024. Some analyst forecasts suggest ROE may remain near or above 20% in the following years. This elevated profitability, together with the bank’s strong position in retail banking, may help explain why it can trade at a higher P/B ratio than some peer banks.
How to Use All Three Metrics Together
The power of these metrics comes from combining them — each one alone can be misleading; together they paint a complete picture.
Frequently Asked Questions
Q: What is a good P/B ratio for a Saudi bank stock?
A P/B of 2.0–3.5x may be a common range for high-ROE Saudi Islamic banks, but each bank’s valuation depends on profitability, asset quality, expected growth, and market conditions. Conventional Saudi banks with moderate ROE (12–16%) typically trade at 1.0–2.0x book. P/B above 4x for any bank requires exceptional ROE justification.
Q: Should I use P/E or P/B for Saudi bank analysis?
Both. P/E is useful for comparing banks to their own history and to non-bank peers. P/B is specifically important for banks because their assets and liabilities (primarily loans and deposits) are the business, book value is a more directly meaningful measure of intrinsic value for banks than for asset-light companies.
Q: What ROE should I expect from a strong Saudi non-bank stock?
For non-financial TASI companies, ROE above 15% consistently suggests a strong competitive position. Saudi healthcare and telecom companies in the 15–25% ROE range are generally considered quality businesses. ROE below 8% consistently warrants investigation, either the industry has structural challenges or the specific company has capital allocation problems.
Q: How do I find P/B, EPS, and ROE for TASI stocks?
These metrics are published by Argaam (argaam.com), Bloomberg Arab (arabic.bloomberg.com), and directly on the Saudi Exchange (saudiexchange.sa) company profiles. Major TASI stocks also have dedicated investor relations pages that publish these metrics in their quarterly earnings presentations.
Analyse Saudi and US stocks using fundamental metrics on Raseed — then invest from $1 with confidence. → Start your research-backed investing on Raseed →
Related Articles on Raseed Learn
How to Read an Earnings Report
How to Research GCC Stocks: Fundamental Analysis
TASI vs S&P 500 10-Year Comparison
Best Tech Sectors to Invest In
This article is for educational and informational purposes only and does not constitute investment advice. All investing involves risk, including the potential loss of principal. Data sourced from publicly available primary sources as of June 2026. Past performance does not guarantee future results. Securities brokerage services are provided by Fullerverse (SC) Limited, licensed and regulated by the Financial Services Authority Seychelles (Licence No. SD152), a wholly-owned subsidiary of Raseed Invest Inc. Raseed Invest Limited is regulated by the DFSA. Capital is at risk.